
What Energy Surplus Is Really Worth: A Numerical Comparison of Storage, Bitcoin, and Waste
Energy surplus is usually discussed in abstract terms: oversupply, curtailment, negative prices. What is rarely shown is what surplus is actually worth in numbers, and how different system designs convert the same surplus into radically different outcomes. This article removes ideology and shows the math. One real-world solar project. Four different system choices. Clear costs, profits, and risks.
SYSTEM DESIGN & OPTIONALITYENTROPY888 PERSPECTIVE
Chris Boubalos
1/23/2026
Baseline Project (Common to All Scenarios)
Asset: 100 MW Solar PV
Capacity factor: 22%
(reflecting that PV produces only during daylight and seasonal windows)
Annual production:
100 MW × 8,760 h × 22% ≈ 192,700 MWh
Average curtailment (conservative): 20%
→ Curtailed energy: 38,540 MWh / year
Energy sold to grid: 154,160 MWh
Average realized price: €55 / MWh
→ Annual grid revenue: €8.48 million
The question is not theoretical:
What do we do with the 38,540 MWh that cannot be sold?
Grid-First Operation With Curtailment-Only Mining (Critical Clarification)
The system remains strictly grid-first.
All available energy is offered to the grid up to the permitted export limit and at economically rational prices. Bitcoin mining operates behind the meter and consumes only surplus energy that would otherwise be curtailed or sold at zero or negative value.
A real-time power controller continuously monitors PV output, export limits, and curtailment signals. When grid export is constrained or uneconomic, the controller dynamically ramps mining load up to absorb the excess. When grid demand or prices recover, mining load is reduced or shut down immediately.
Bitcoin mining therefore does not compete with grid sales, does not cannibalize power revenues, and functions purely as a flexible energy sink.
This architecture reflects the system logic discussed in Why Energy Systems Need Sinks, Not Just Buffers.
Scenario A — Waste (Do Nothing)
CAPEX: €0
Revenue from surplus: €0
Profit from surplus: €0
38,540 MWh are lost every year.
This is the default outcome in most renewable systems today, and the structural failure described in Why Energy Storage Alone Will Never Fix Oversupply.
Scenario B — Battery Only (Buffer)
Assume a typical utility-scale addition:
Battery size: 50 MW / 100 MWh
Battery CAPEX: ~€38 million
After spread compression, degradation, and cycling limits, real-world results are:
Net annual uplift: ~€1.0 million / year
Outcome:
Very high capital intensity
Still seasonal oversupply
No revenue floor
No restoration funding
Storage buffers energy. It does not terminate surplus.
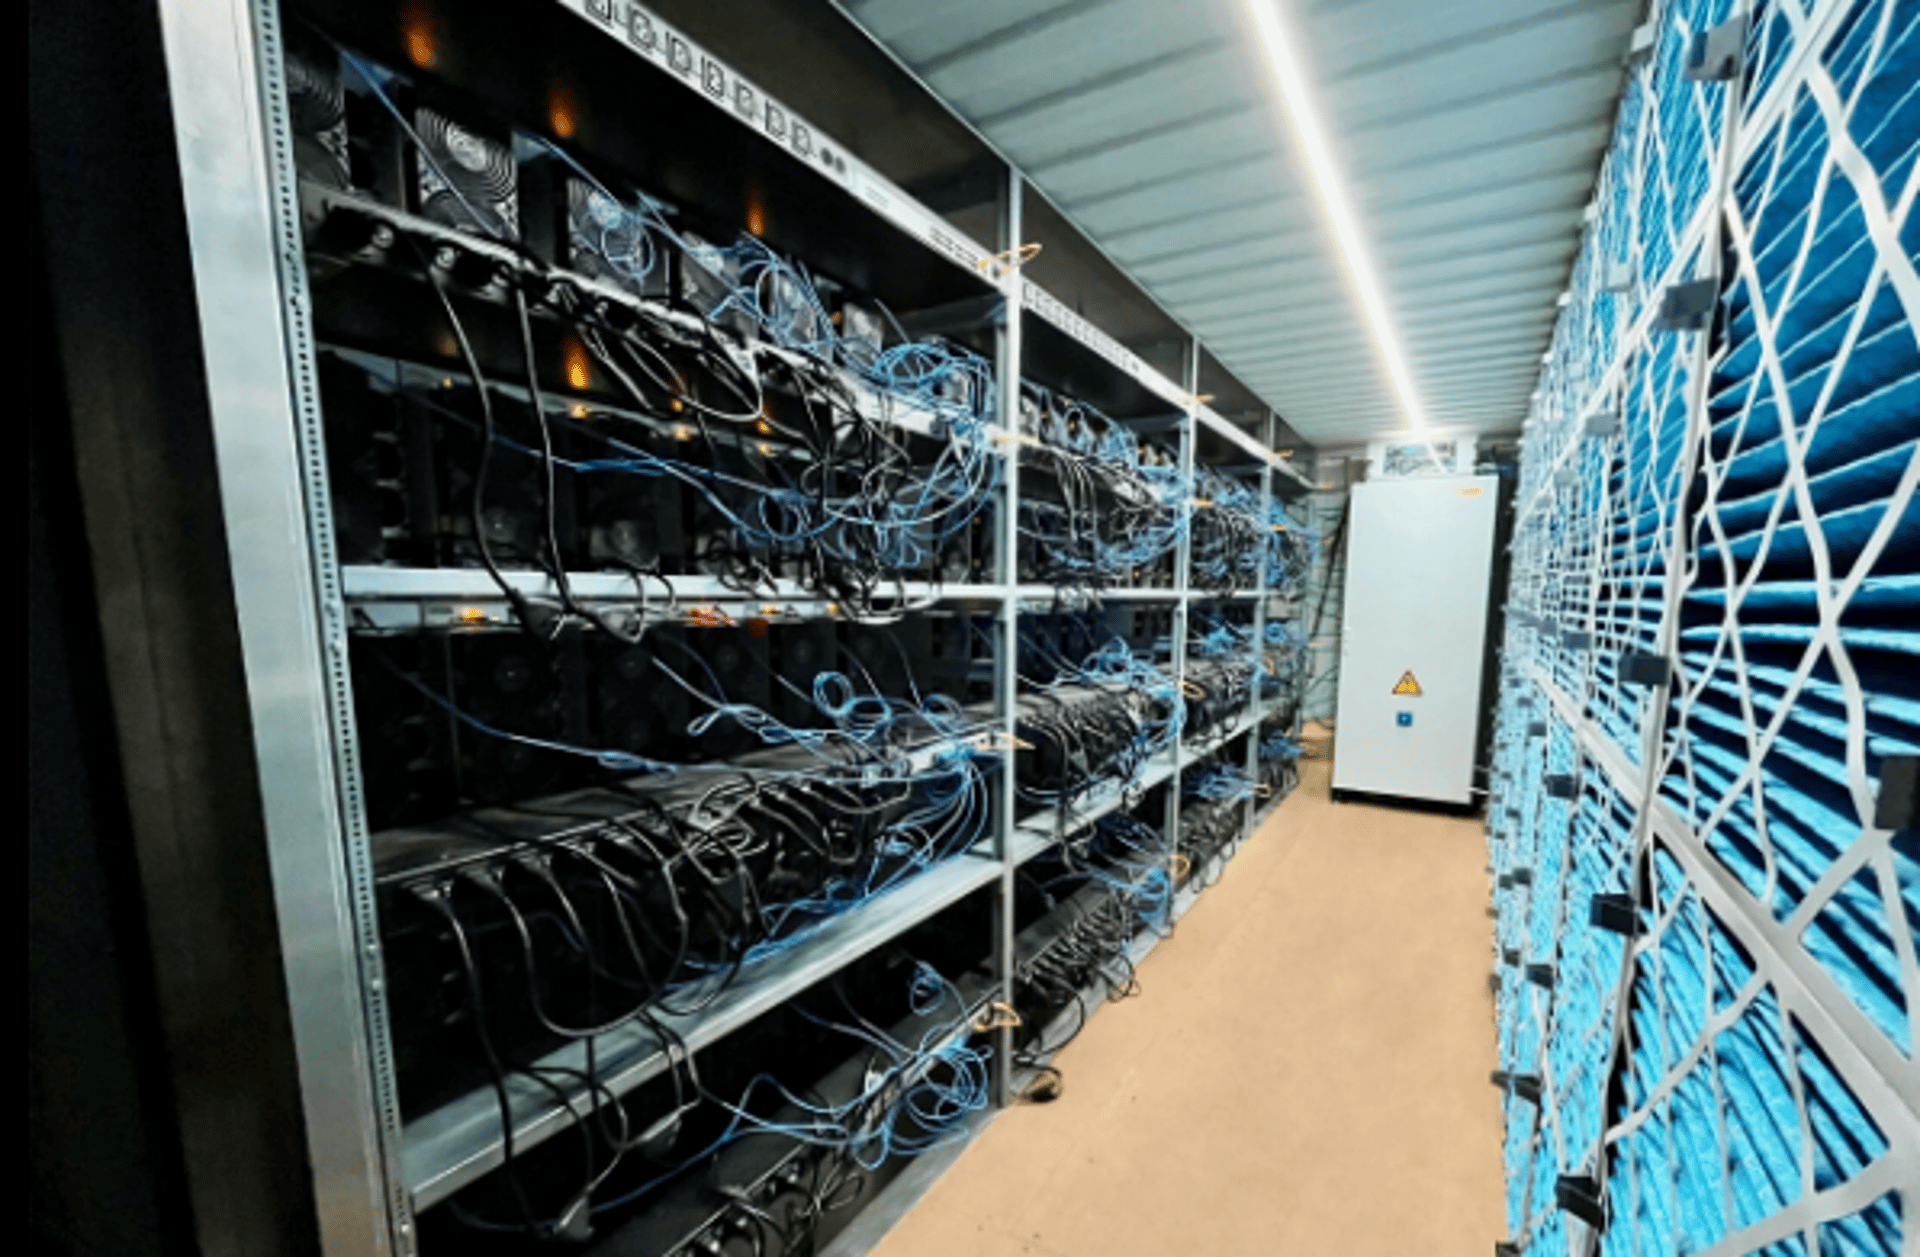
Scenario C — Bitcoin Mining (Sink)
Mining sized strictly to curtailment
We do not oversize miners.
Average surplus power:
38,540 MWh / 8,760 h ≈ 4.4 MWMining load selected: 5 MW
Miner assumptions (explicit)
Miner class: ~200 TH/s @ 3.5 kW
Miner price (landed): $3,500 / unit
Infrastructure (containers, power, cooling, networking): +25%
Total miners:
5,000 kW / 3.5 kW ≈ 1,430 units
Mining CAPEX
Hardware: 1,430 × $3,500 ≈ $5.0M
Infrastructure (+25%): $1.25M
Total mining CAPEX: $6.25M (~€6–6.5M)
Annual O&M
~3% of CAPEX ≈ $0.19M / year
Mining Revenue at BTC = $75,000 (Today)
We use network share, not optimistic €/MWh shortcuts.
Assumptions (conservative):
Post-halving issuance: ~450 BTC/day
Network hashrate: ~650 EH/s
Project hashrate: 0.286 EH/s
BTC/day:
450 × (0.286 / 650) ≈ 0.198 BTC/day
Gross annual (100% runtime):
0.198 × 365 × $75,000 ≈ $5.42M
Curtailment-based runtime (~88%):
→ $4.77M / year
Net mining profit:
$4.77M − $0.19M ≈ $4.58M / year
Scenario D — Battery + Bitcoin (Hybrid)
Battery improves short-duration shifting and miner utilization.
Conservative assumption:
Mining profit uplift: +15% → ~$5.27M
Battery profit: €1.0M
Total incremental profit:
≈ €5.8–6.0M / year
Total CAPEX:
€38M (battery) + €6.5M (mining) ≈ €44.5M
The Comparison
Waste
CAPEX: €0
Profit: €0
Result: Value destruction
Battery only
CAPEX: ~€38M
Profit: ~€1.0M / year
Result: Buffering, no sink
Bitcoin only
CAPEX: ~€6.5M
Profit: ~€4.2–4.6M / year
Result: Curtailment monetized (sink)
Battery + Bitcoin
CAPEX: ~€44.5M
Profit: ~€5.8–6.0M / year
Result: Buffer + sink (capital-heavy)
Bitcoin Drawdown Reality (Explicit)
Bitcoin is volatile. We model it directly.
Historical pattern:
Major drawdowns every 3–4 years
Typical cycle drawdown: −60% to −70%
Stress scenario
BTC falls from $75k → $30k
Network difficulty unchanged (worst case)
Mining profit falls proportionally:
~$4.6M → ~$1.8M / year
Still positive.
Still materially better than battery-only.
This confirms the resilience argument made in Why Flexible Demand Beats Infinite Storage.
The Role of Entropy888
Entropy888 is not a miner vendor.
Its role is systemic:
System design
Mining sized to curtailment profiles, not nameplate MW.Deployment & operations
Containerized, behind-the-meter, dispatch-aware operation.Collaborative investment
Mining infrastructure can be provided as participating capital
(revenue share instead of fixed debt).Restoration loop
A defined share of Bitcoin-derived value allocated to forests and land repair, aligning with Why Restoration Will Become a Hard Requirement for Energy Assets.
Final Selection — Clear Winner
Waste destroys value.
Battery-only is capital-heavy and incomplete.
Bitcoin-only delivers the highest return per euro invested.
Battery + Bitcoin is optimal only when capital is abundant.
Winner for most projects:
Bitcoin mining as a sink, optionally combined with storage later.
Correct sequence:
Install the sink first
Add buffers only if they improve the sink
Conclusion: This Is Not Ideology — It Is Arithmetic
Energy surplus is not a technical failure.
It is an accounting failure.
When surplus is wasted, value disappears.
When surplus is buffered, value is delayed.
When surplus is sunk, value survives.
The difference between fragile renewables and resilient systems is not technology.
It is architecture — and math.
Contact
© 2025 Entropy888. All rights reserved.
Powered by Renewable Energy.
Christos Boubalos - Business Development Lead +306972 885885 mob/whatsapp
christos@entropy888.com
-------------------------------------------
General Enquiries - info@entropy888.com